


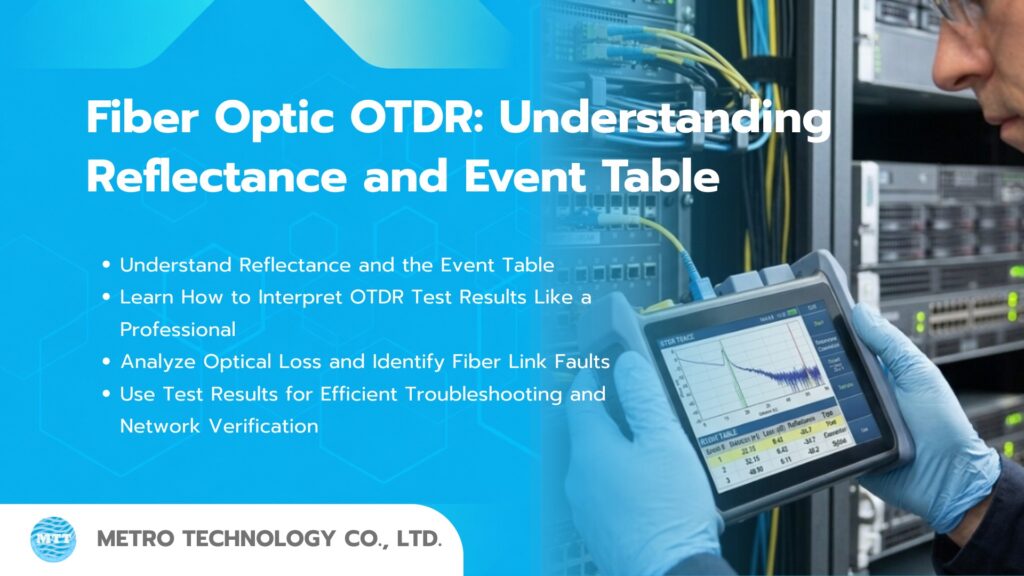
When testing and analyzing fiber optic cabling systems using an OTDR (Optical Time Domain Reflectometer), evaluating signal loss and fiber length is only part of the process. Two additional parameters that technicians and network engineers should thoroughly understand are Reflectance and the Event Table.
These two elements provide valuable insights into fiber link quality, helping users identify defects, locate faults, and diagnose network issues with greater accuracy.
In many cases, a fiber link may pass optical loss requirements, yet still experience communication problems, unstable connections, or elevated Bit Error Rates (BER). Such issues can often be traced to excessive reflectance levels or abnormalities revealed within the OTDR Event Table.
This article explains how to correctly interpret Reflectance values and Event Table data, enabling more effective and professional OTDR analysis.
What is Reflectance?
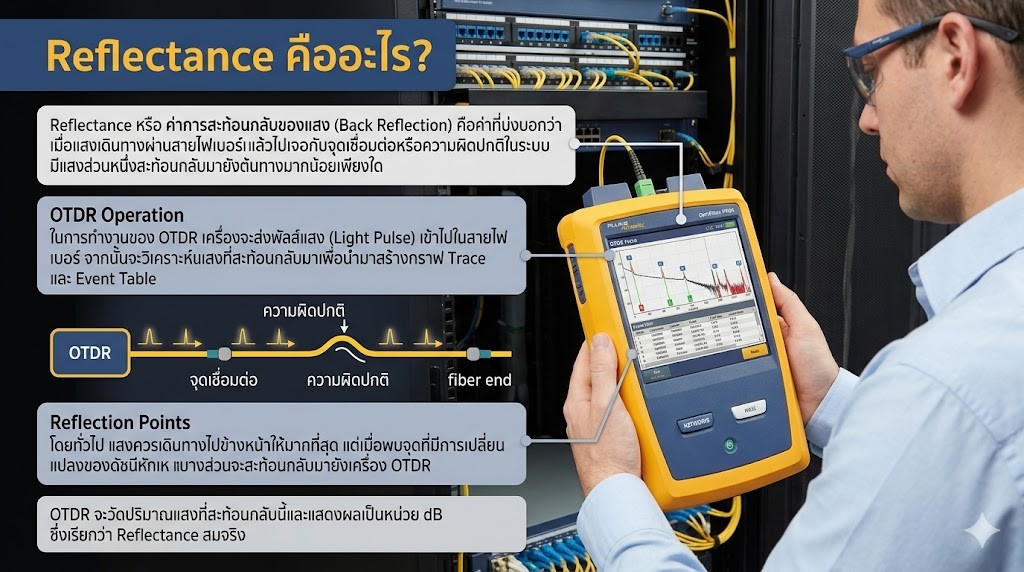
Reflectance, also known as Back Reflection, is a measurement that indicates how much optical power is reflected back toward the source when light encounters a connection point or an irregularity within a fiber optic link.
During an OTDR test, the instrument launches a series of optical pulses into the fiber and then analyzes the light that is reflected back. This information is used to generate both the OTDR trace and the Event Table.
Ideally, most of the optical signal should continue traveling forward through the fiber. However, whenever the light encounters a change in refractive index, a connector interface, an air gap, or another discontinuity, a portion of the signal is reflected back toward the OTDR.
The OTDR measures the amount of reflected optical power and displays it as a value in decibels (dB), known as Reflectance.
How Does Reflectance Occur?
As light travels through the fiber core, it is confined within the glass by the principle of Total Internal Reflection. However, when the optical signal encounters a point where there is a change in material, structure, or refractive index, a portion of the light may be reflected back toward the source.
Common causes of reflectance include:
- Fiber optic connectors
- Mating points between two connectors
- Air gaps between fiber interfaces
- Cracks or damage in the fiber glass
- Open fiber ends
- Severe bends or breaks in the fiber cable
This reflected light is known as Fresnel Reflection.
The greater the amount of reflected light, the higher the reflectance level. In OTDR measurements, this means the reflectance value becomes less negative (for example, -25 dB is worse than -55 dB).
Why Is Reflectance Important?
Many technicians who are new to OTDR testing tend to focus primarily on Optical Loss, since it is the primary parameter used to determine whether a fiber link passes installation requirements. However, Reflectance is equally important, especially in today’s high-speed optical communication systems.
Even if a fiber link meets the acceptable loss budget, excessive back reflection can significantly affect network equipment performance and signal quality.
Reduced Signal Quality
When excessive reflected light travels back into the system, the receiver may receive unwanted optical noise along with the intended signal. This can lead to several issues, including:
- Signal waveform distortion
- Narrower eye diagrams
- Reduced Signal-to-Noise Ratio (SNR)
- Overall degradation of data quality
In the early stages, users may not notice any obvious symptoms. However, as network traffic increases or the system operates continuously over long periods, instability and performance degradation may begin to appear.
Increased Bit Error Rate (BER)
Bit Error Rate (BER) represents the frequency of data transmission errors within a communication system.
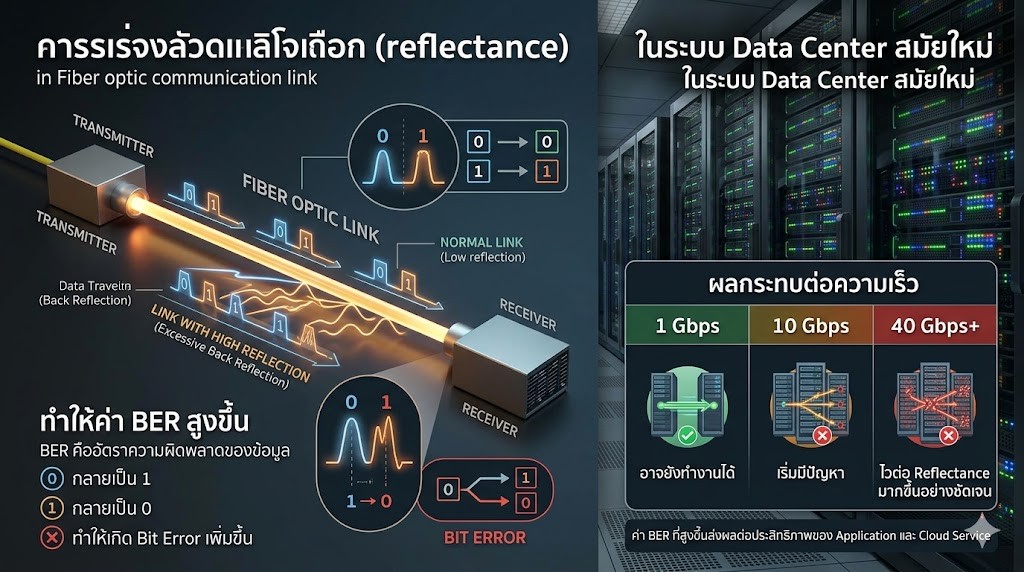
When excessive back reflection is present, the receiver may incorrectly interpret incoming data. For example:
- A binary 0 may be detected as a 1
- A binary 1 may be detected as a 0
As a result, the BER increases.
The impact of reflectance becomes more significant as network speeds increase:
- 1 Gigabit Ethernet may continue to operate normally
- 10 Gigabit Ethernet can begin to show performance issues
- 40 Gigabit Ethernet and higher-speed systems are considerably more sensitive to reflectance
In modern Data Center environments, even a small increase in BER can negatively affect application performance, cloud services, storage systems, and critical business operations.
Causes Instability in DWDM Systems
DWDM (Dense Wavelength Division Multiplexing) is a technology that transmits multiple communication channels over a single optical fiber, with each channel operating at a different wavelength.
Because multiple wavelengths coexist within the same fiber, DWDM systems are highly sensitive to optical reflections. Excessive back reflection can lead to:
- Crosstalk between channels
- Increased optical noise
- Wavelength distortion
- Reduced efficiency of optical amplifiers
In some cases, certain channels may experience performance degradation or intermittent failures even though the overall optical loss of the link remains within acceptable limits.
As a result, controlling reflectance is a critical requirement in DWDM network design, installation, and maintenance.
Causes Transceiver Malfunctions
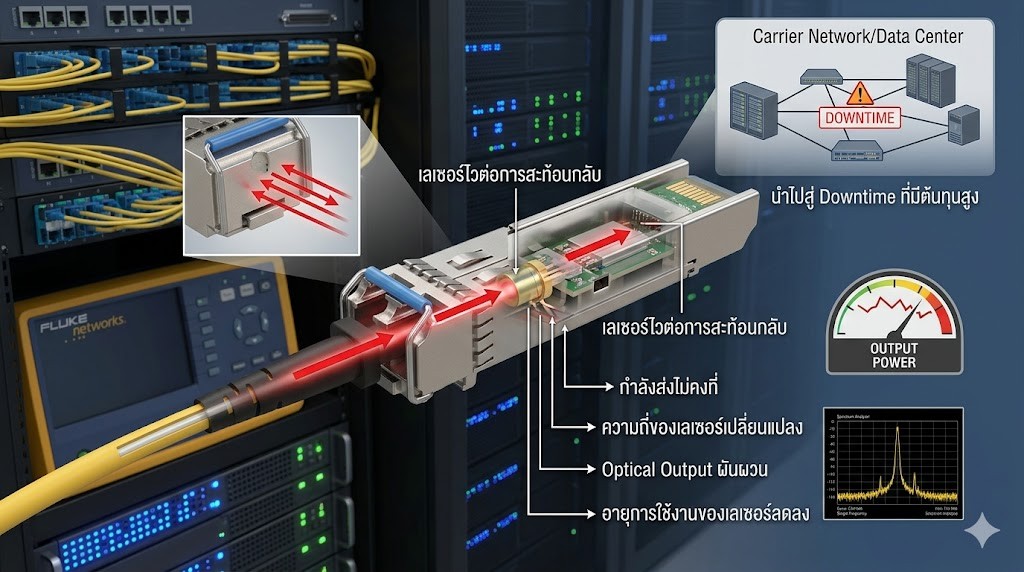
Optical transceivers, particularly laser-based transceivers, are highly sensitive to reflected light.
When reflected optical signals travel back into the laser source, they can interfere with normal laser operation and cause:
- Unstable transmit power
- Laser frequency fluctuations
- Variations in optical output
- Reduced laser lifespan
In carrier-grade telecommunications networks and large-scale data centers, these issues can significantly impact network reliability and may even lead to costly service interruptions or downtime.
For this reason, maintaining low reflectance levels is essential for ensuring long-term transceiver performance and network stability.
Reduces Transmission Distance
Every fiber optic system operates within a defined Optical Power Budget, which represents the amount of optical signal loss the system can tolerate while maintaining reliable communication.
When reflectance is high, a portion of the optical power is reflected back toward the transmitter instead of continuing toward the receiver. As a result, less optical power reaches the far end of the link.
This can lead to:
- Reduced transmission distance
- Lower system margin
- Increased risk of link failure
- Reduced network reliability
The impact becomes particularly noticeable in long-distance fiber applications such as:
- FTTH (Fiber to the Home)
- Metro Ethernet
- Backbone Networks
- Long-Haul Telecommunications Networks
In these environments, even relatively small increases in reflectance can significantly affect overall network performance and available transmission reach.
Causes Signal Interference in High-Speed Networks
As network speeds continue to increase, the duration of each transmitted bit becomes significantly shorter.
For example:
| Data Rate | Time per Bit |
| 1 Gbps | 1 ns |
| 10 Gbps | 100 ps |
| 100 Gbps | 10 ps |
As transmission speeds increase, even a very small amount of reflected light can interfere with the data being transmitted.
Reflected signals may overlap with incoming data signals, causing:
- Signal distortion
- Increased noise levels
- Eye diagram degradation
- Reduced signal integrity
- Higher bit error rates (BER)
At lower data rates, these effects may be negligible. However, in high-speed networks, even minor reflections can have a significant impact on overall system performance.
This is one of the primary reasons why modern high-speed technologies require much stricter reflectance specifications than legacy systems. Maintaining low reflectance is essential to ensuring reliable operation, maximizing transmission performance, and minimizing communication errors in today’s high-bandwidth fiber optic networks.
Why Are These Systems Particularly Sensitive to Reflectance?
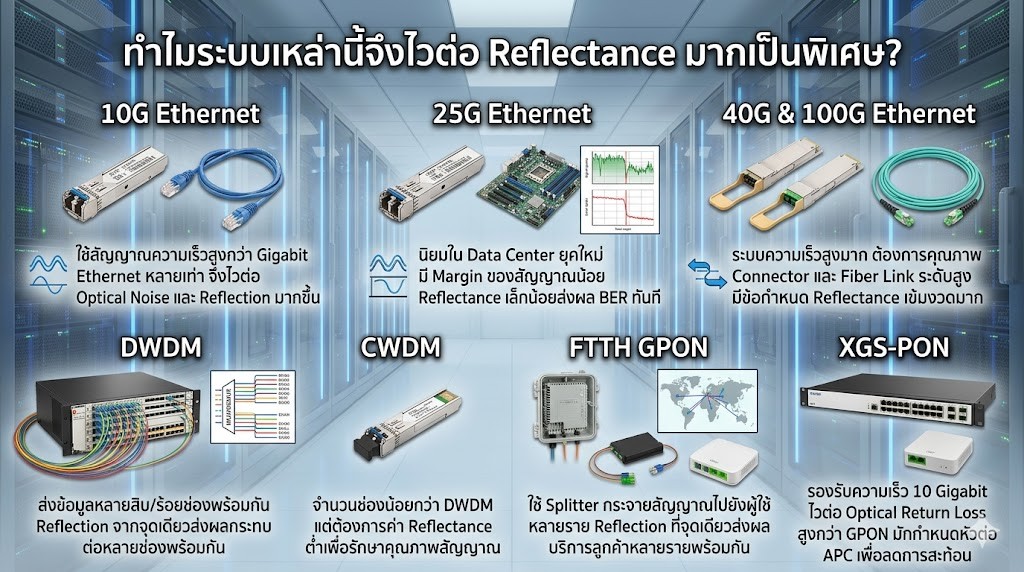
In modern communication networks that support high-speed data transmission or multiple wavelengths simultaneously, Reflectance has become a critical factor that directly affects network stability and performance.
These systems are far more sensitive to noise caused by reflected optical signals than older-generation networks. Even a small amount of back reflection can impact signal quality, transmitter performance, and data integrity.
As a result, maintaining low reflectance levels has become an essential requirement in fiber optic installation, testing, and certification processes, particularly in the following applications:
10G Ethernet
10G Ethernet operates at significantly higher data rates than traditional Gigabit Ethernet. As transmission speed increases, the system becomes more sensitive to optical noise and reflections, making reflectance control increasingly important.
25G Ethernet
Widely deployed in modern data centers, 25G Ethernet typically operates with tighter signal margins than previous generations. Even a small amount of reflectance can negatively affect the Bit Error Rate (BER) and overall link performance.
40G and 100G Ethernet
These ultra-high-speed Ethernet technologies require exceptional fiber link quality and connector performance. Consequently, they have much stricter reflectance requirements to ensure reliable operation and maximum signal integrity.
DWDM (Dense Wavelength Division Multiplexing)
DWDM systems transmit dozens or even hundreds of wavelength channels over a single fiber. Reflection occurring at a single point can affect multiple channels simultaneously, leading to increased optical noise, crosstalk, and degraded network performance.
CWDM (Coarse Wavelength Division Multiplexing)
Although CWDM uses fewer wavelength channels than DWDM, it still requires low reflectance levels to maintain signal quality and ensure stable communication across all channels.
FTTH GPON
GPON (Gigabit Passive Optical Network) distributes optical signals to multiple subscribers through passive optical splitters. Reflections occurring anywhere within the network can potentially affect service quality for multiple users at the same time, making reflectance management an important aspect of network reliability.
XGS-PON
XGS-PON supports symmetrical 10 Gigabit transmission speeds and is more sensitive to Optical Return Loss (ORL) than earlier GPON systems. For this reason, APC (Angled Physical Contact) connectors are commonly specified to minimize back reflections and maintain optimal network performance.
Because of these factors, modern high-speed fiber optic systems often include strict reflectance and return loss requirements as part of their installation and certification standards, ensuring stable operation, lower error rates, and long-term network reliability.
What Is a Good Reflectance Value?
The basic principle of Reflectance is simple: the more negative the value, the better.
Reflectance measures the amount of optical power that is reflected back toward the source from various points within a fiber optic link. When less light is reflected, it indicates that most of the optical energy is successfully passing through the connection and continuing toward the receiver.
As a result, lower reflectance (more negative dB values) generally indicates better connector quality, cleaner fiber interfaces, and higher overall link performance.
Typical Reflectance Quality Levels
| Reflectance | Quality |
| -20 dB | Poor |
| -30 dB | Fair |
| -40 dB | Good |
| -50 dB | Very Good |
| -60 dB or lower | Excellent |
Understanding Reflectance Through Examples
To make the concept easier to understand:
- A Reflectance of -20 dB indicates a relatively high amount of reflected light returning toward the transmitter.
- A Reflectance of -40 dB indicates significantly less reflected light and a much better optical connection.
- A Reflectance of -60 dB indicates extremely low reflection levels, with virtually no reflected light affecting system performance.
Therefore, although all reflectance values are expressed as negative numbers, a value with a larger negative magnitude represents better performance.
For example:
- -55 dB is significantly better than -35 dB
- -60 dB is better than -50 dB
- -40 dB is better than -30 dB
This is because each decrease in reflectance represents a substantial reduction in the amount of optical energy being reflected back into the network.
Why Lower Reflectance Matters
Lower reflectance helps:
- Improve signal quality
- Reduce optical noise
- Minimize Bit Error Rate (BER)
- Increase network stability
- Protect sensitive optical transceivers
- Improve DWDM and CWDM system performance
- Support reliable operation of high-speed Ethernet networks
- Enhance GPON and XGS-PON service quality
For this reason, modern fiber optic installations often specify strict reflectance requirements, especially in high-speed networks, data centers, telecommunications infrastructure, and passive optical networks where even small amounts of reflected light can impact overall system performance.
Typical Reflectance Values for Different Fiber Optic Components
The amount of optical reflection in a fiber optic system largely depends on the type of connection used within the link. Different connection methods and connector designs can produce significantly different reflectance levels, which directly affect overall network performance.
Fusion Splice
A Fusion Splice joins two optical fibers by permanently fusing the glass cores together using an electric arc. Because there is virtually no physical gap between the fibers, reflections are extremely low.
Typical Reflectance values for Fusion Splices range from -60 dB to -70 dB or better.
As a result, Fusion Splicing is considered the connection method with the lowest back reflection and is widely used in modern backbone and telecommunications networks where maximum optical performance is required.
Advantages of Fusion Splicing:
- Extremely low reflectance
- Very low insertion loss
- High long-term reliability
- Ideal for long-distance fiber networks
- Preferred for carrier-grade and backbone infrastructure
UPC Connector
A UPC (Ultra Physical Contact) Connector is one of the most commonly used connector types in LAN, Data Center, and Enterprise Network environments.
UPC connectors feature a highly polished ferrule surface designed to minimize the air gap between mating connectors, thereby reducing reflection compared to standard PC connectors.
Typical Reflectance values for UPC connectors range from -40 dB to -55 dB.
When properly installed, inspected, and cleaned, UPC connectors provide excellent performance and are capable of supporting modern high-speed networking applications.
Common Applications:
- Enterprise Networks
- Data Centers
- Campus Networks
- Fiber LAN Systems
- High-Speed Ethernet Links
APC Connector
An APC (Angled Physical Contact) Connector is specifically designed to minimize optical reflections. The connector end face is polished at an angle of approximately 8 degrees, causing reflected light to be redirected into the cladding rather than back toward the optical source.
Because of this design, APC connectors provide significantly lower reflectance than UPC connectors.
Typical Reflectance values for APC connectors range from -60 dB to -70 dB.
This makes APC connectors the preferred choice for applications that require exceptionally low back reflection and superior signal quality.
Common Applications:
- FTTH (Fiber to the Home)
- GPON Networks
- XGS-PON Networks
- DWDM Systems
- CATV Optical Networks
- Metro Networks
In these applications, minimizing reflectance is critical because even small amounts of reflected light can affect optical transmitters, increase error rates, and degrade overall network performance.
For this reason, APC connectors have become the industry standard in many modern passive optical networks and telecommunications infrastructures where low reflectance is a key requirement.
Common Causes of High Reflectance
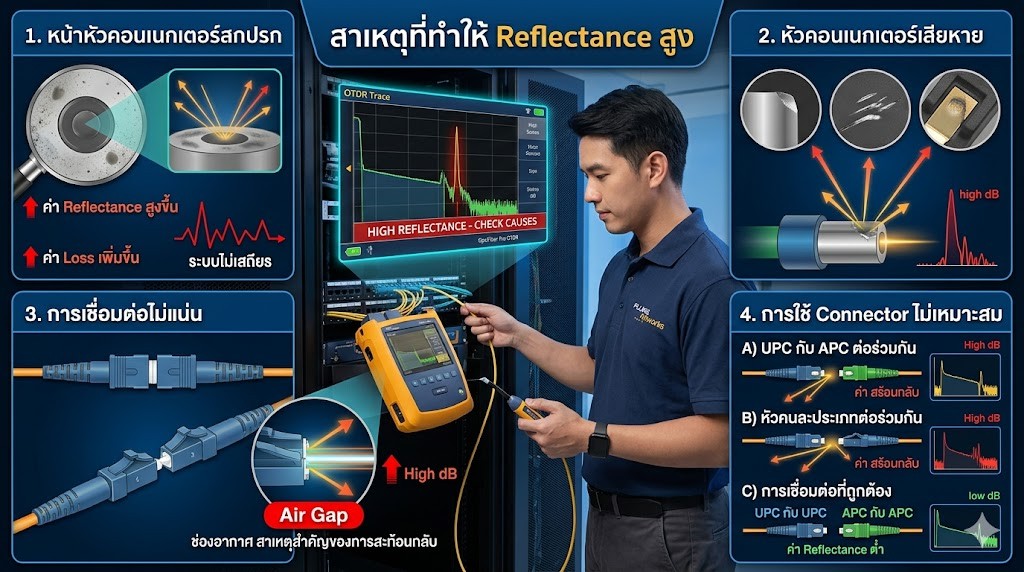
If an OTDR measurement shows a reflectance value that is higher than expected, it may indicate an issue somewhere within the fiber optic link. Excessive reflectance can negatively impact network performance and should be investigated promptly.
1. Dirty Connector End Faces
Dust, dirt, or oil contamination on the connector end face is one of the most common causes of high reflectance in fiber optic systems.
Potential effects include:
- Increased reflectance
- Higher insertion loss
- Reduced signal quality
- Unstable network performance
For this reason, connector end faces should always be inspected and cleaned before testing or connecting fiber links.
2. Damaged Connectors
Physical damage to a connector can significantly increase the amount of light reflected back toward the source.
Examples include:
- Chipped ferrules
- Scratched end faces
- Damaged contact surfaces
- Cracked connector components
These defects disrupt the optical interface and often cause higher-than-normal reflectance values.
3. Loose Connections
A connector that is not fully inserted or properly secured can create an air gap between mating connector surfaces.
This air gap becomes a major source of optical reflection because light encounters a sudden change in refractive index between the glass fiber and the air.
As a result, loose connections can lead to:
- Increased reflectance
- Higher insertion loss
- Intermittent connectivity issues
- Unstable link performance
Proper connector mating and secure installation are essential to minimize these problems.
4. Incorrect Connector Matching
Using incompatible connector types together can immediately create excessive reflectance.
Examples include:
- Connecting a UPC connector to an APC connector
- Mating different connector polish types
- Mixing connector standards within the same link
These mismatches prevent proper physical contact between the connector end faces and can generate significant back reflections.
As a best practice, connector types should always be matched according to the network design and manufacturer specifications to ensure optimal optical performance and low reflectance.
What is an Event Table?
An Event Table is a summary list of all events detected by an OTDR along the entire fiber optic link. It functions as a comprehensive inspection report that systematically presents detailed information about every significant point on the fiber cable.
Instead of requiring users to manually analyze each point on the OTDR trace graph, the OTDR processes the trace data and converts it into an easy-to-read table. This allows technicians and engineers to quickly identify what occurred and where it occurred along the fiber link.
As a result, the Event Table is considered one of the most important OTDR features because it significantly improves the speed and accuracy of troubleshooting, project acceptance testing, and ongoing maintenance.
Information Displayed in an Event Table
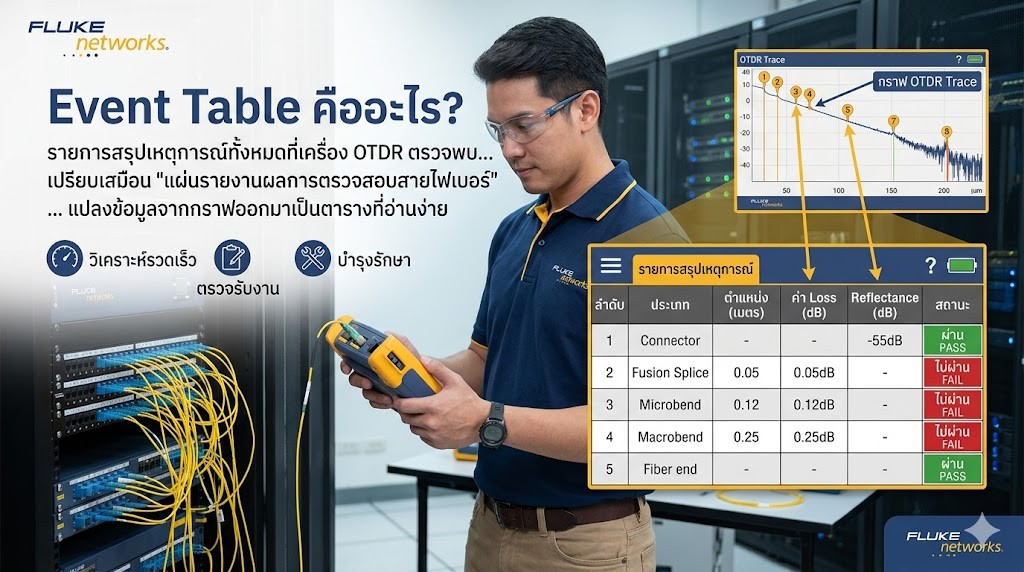
A typical Event Table contains several key parameters:
1. Event Number
The Event Number identifies each event detected by the OTDR along the fiber link.
Example:
| Event | Description |
| 1 | Launch Connector |
| 2 | Fusion Splice |
| 3 | Mid-Link Connector |
| 4 | Macro Bend |
| 5 | End Connector |
Numbering each event makes it easier to correlate the Event Table with specific locations on the OTDR trace.
2. Distance
Distance indicates the location of an event measured from the OTDR connection point.
Example:
| Event | Distance |
| 1 | 0 m |
| 2 | 523 m |
| 3 | 1,245 m |
| 4 | 2,180 m |
| 5 | 3,500 m |
This information is extremely valuable when locating faults in the field.
For example, if the OTDR detects a fiber break at 1,872 meters, technicians can immediately inspect that specific area rather than searching the entire route.
3. Event Loss
Event Loss indicates the amount of signal attenuation occurring at a specific event, measured in decibels (dB).
Example:
| Event Type | Loss |
| Fusion Splice | 0.03 dB |
| Connector | 0.25 dB |
| Macro Bend | 1.50 dB |
Event Loss is a key indicator of connection quality.
For example:
- A high-quality Fusion Splice should typically have a loss below 0.1 dB.
- Connectors generally exhibit losses between 0.2 and 0.5 dB.
- Excessive loss may indicate poor installation, contamination, misalignment, or damaged components.
4. Reflectance
Reflectance measures the amount of light reflected back toward the source at each event, expressed in dB.
Example:
| Event Type | Reflectance |
| UPC Connector | -45 dB |
| APC Connector | -65 dB |
| Open Fiber End | -14 dB |
Reflectance data provides valuable insight into the quality of connectors and connection points.
In many cases, an event may show acceptable insertion loss while exhibiting abnormally high reflectance. This can be an early warning sign of connector contamination, poor polishing quality, physical damage, or improper mating.
5. Event Type
Modern OTDRs can automatically classify the type of event detected along the fiber link.
Reflective Events
Reflective events generate a noticeable amount of back reflection.
Common examples include:
- Connectors
- Adapters
- Mechanical Splices
- Open Fiber Ends
On an OTDR trace, reflective events typically appear as sharp spikes.
Non-Reflective Events
Non-reflective events introduce loss but produce little or no back reflection.
Common examples include:
- Fusion Splices
- Macro Bends
- Micro Bends
On the OTDR trace, these events usually appear as step-down transitions rather than spikes.
End of Fiber
The OTDR identifies the physical end of the fiber link.
This event often exhibits very high reflectance because the light reflects strongly from the open fiber end back toward the OTDR.
6. Section Loss
Some OTDR models can calculate the total loss between two consecutive events.
Example:
| Section | Loss |
| Event 1 → Event 2 | 0.20 dB |
| Event 2 → Event 3 | 0.35 dB |
| Event 3 → Event 4 | 1.80 dB |
This feature allows technicians to quickly identify which segment of the fiber link is contributing the most attenuation.
In the example above, it is immediately apparent that the primary issue is located between Event 3 and Event 4, where the loss is significantly higher than in the other sections.
By combining information such as Distance, Event Loss, Reflectance, Event Type, and Section Loss, the Event Table provides a powerful diagnostic tool that enables engineers and technicians to accurately assess fiber link quality, pinpoint faults, and perform troubleshooting much more efficiently than relying on the OTDR trace alone.
Why Is the Event Table Important?
Although an OTDR Trace provides highly detailed information about a fiber optic link, interpreting the trace correctly often requires considerable experience and expertise. The Event Table simplifies this process by converting complex trace data into easy-to-read numerical values and structured information.
This enables technicians and engineers to:
- Quickly identify fault locations
- Accurately locate fiber breaks
- Verify the quality of connectors and fusion splices
- Analyze loss and reflectance values
- Generate professional test reports
- Compare historical test results
- Reduce troubleshooting time
In large-scale projects such as Data Centers, FTTH networks, Metro Networks, and Backbone Fiber infrastructures, where hundreds or even thousands of fiber links may need to be tested and maintained, the ability to read and interpret an Event Table becomes an essential skill.
Rather than spending significant time analyzing OTDR traces individually, engineers can use the Event Table to rapidly assess the condition of each fiber link, identify abnormal events, and prioritize corrective actions more efficiently.
The Event Table also plays a critical role in project acceptance testing and long-term network maintenance. Because it provides precise information about event locations, loss values, and reflectance measurements, it allows maintenance teams to compare current test results with previous records and quickly detect any deterioration in network performance over time.
In many cases, the Event Table serves as the primary source of information during troubleshooting, while the OTDR trace is used for deeper analysis when additional investigation is required.
A useful way to think about the relationship between these two tools is:
- The OTDR Trace is like an X-ray image of the fiber optic link, revealing the detailed structure and behavior of the cable.
- The Event Table is like the diagnostic report, summarizing the findings and highlighting the key information needed to identify problems quickly and accurately.
For this reason, understanding how to read and interpret an Event Table is one of the most valuable skills for fiber optic technicians, network engineers, and anyone responsible for testing, certifying, or maintaining fiber optic infrastructure.
Reflectance and Event Table Should Be Analyzed Together
Accurate OTDR analysis should never rely solely on Loss measurements. While insertion loss indicates how much signal power is lost at a particular event, it does not always reveal the overall quality of the connection.
Consider the following example:
| Event | Loss | Reflectance |
| Connector A | 0.25 dB | -65 dB |
| Connector B | 0.25 dB | -28 dB |
Although both connectors exhibit the same insertion loss, Connector B has significantly higher reflectance, indicating a potential issue at that connection point.
Possible causes include:
- A contaminated connector end face
- An air gap between mating connectors
- A damaged connector ferrule
- Improper connector mating
- Poor connector polishing quality
If only the Loss value is considered, both connectors may appear acceptable. However, the Reflectance measurement reveals that Connector B could negatively impact network performance and potentially cause future reliability issues.
For this reason, evaluating Loss and Reflectance together provides a much more complete picture of fiber link quality and helps identify problems that might otherwise go unnoticed.
Common Mistakes When Interpreting OTDR Results
Even experienced technicians occasionally overlook important OTDR information. Some of the most common mistakes include:
Looking Only at Loss Values
Many users focus exclusively on insertion loss while ignoring reflectance measurements.
As a result, connectors with acceptable loss but excessive back reflection may remain undetected until network performance issues arise.
Ignoring Events with High Reflectance
An event may show minimal loss while exhibiting unusually high reflectance.
Such events often indicate:
- Dirty connectors
- Damaged connector end faces
- Air gaps
- Poor mechanical connections
These issues can significantly affect high-speed optical networks even when loss values appear normal.
Assuming Every Fusion Splice Should Have Reflectance
A properly performed fusion splice is generally classified as a non-reflective event.
Therefore, significant reflectance at a fusion splice location may indicate:
- Poor splice quality
- Fiber damage
- A misidentified event
Understanding this distinction is essential for accurate OTDR interpretation.
Analyzing Only the OTDR Trace and Ignoring the Event Table
While the OTDR trace contains detailed information, relying solely on the graphical display can make troubleshooting slower and more difficult.
The Event Table provides:
- Event locations
- Loss values
- Reflectance measurements
- Event classifications
allowing technicians to identify issues much more efficiently.
Drawing Conclusions from Only One Test Wavelength
Fiber optic behavior can vary significantly depending on the test wavelength used.
Some problems may not be apparent at one wavelength but become obvious at another.
Failing to Compare 1310 nm and 1550 nm Results
For Single-Mode Fiber testing, comparing results at 1310 nm and 1550 nm is extremely important.
For example:
- Macro bends often produce significantly higher loss at 1550 nm.
- Certain installation defects may appear normal at 1310 nm but become clearly visible at 1550 nm.
- Comparing both wavelengths helps identify hidden issues before they affect network performance.
This is why professional OTDR analysis should always include evaluation of both wavelengths whenever possible.
Conclusion
Reflectance and Event Table data are essential components of professional OTDR analysis. While Reflectance is used to evaluate the quality of connections and the amount of light reflected back toward the source, the Event Table provides a detailed summary of every event detected along the fiber link, including location, loss, reflectance, and event type.
When analyzed together, these two sources of information enable technicians and engineers to accurately identify faults, determine the root causes of network issues, and develop effective corrective actions.
A thorough understanding of Reflectance and Event Table interpretation can significantly reduce troubleshooting time, improve network reliability, support more accurate project acceptance testing, and help ensure that fiber optic installations meet professional industry standards.